Printing, Loading, Measuring, and Verifying a Color Chart
Measuring charts is an essential step for printmode creation. Whether the measurement is for Separation Curves, Calibration, or ICC Creation, the process is the same. If following the Full Printmode Creation process, all three measurement steps will be required.
The Measuring Charts page retains the information from the selected printmode. Verify the Printer, Queue, Spectrophotometer, and Page Size is correct before continuing.
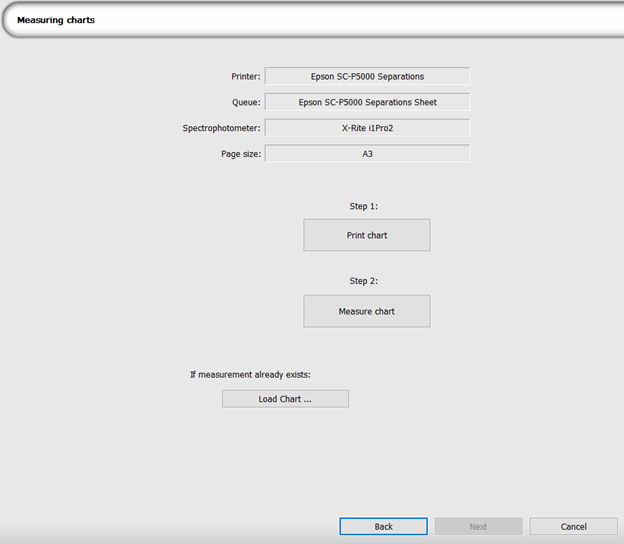
To begin the process of scanning, you must first print the proper chart. Click the Print Chart button, and the chart will automatically be placed in the correct queue. This job file will likely contain multiple individual charts. This is normal, and each chart will be used during the scanning process. Print the chart as you would output any job.
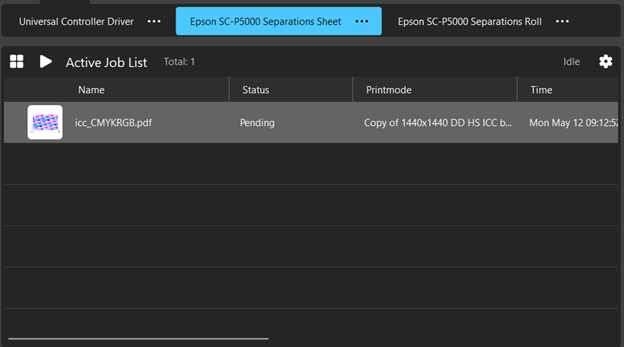
When the chart has been successfully loaded into the queue, a checkmark will appear in the Measuring Charts page next to the Print Chart button for confirmation.
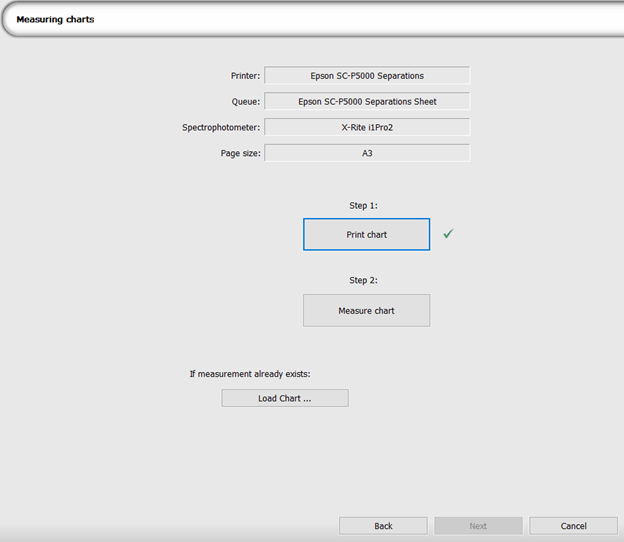
Once the chart has been printed, the next step is to measure the chart. Click the Measure Chart button. This will launch the measurement service program. Proceed with any calibration steps until the chart measurement page.
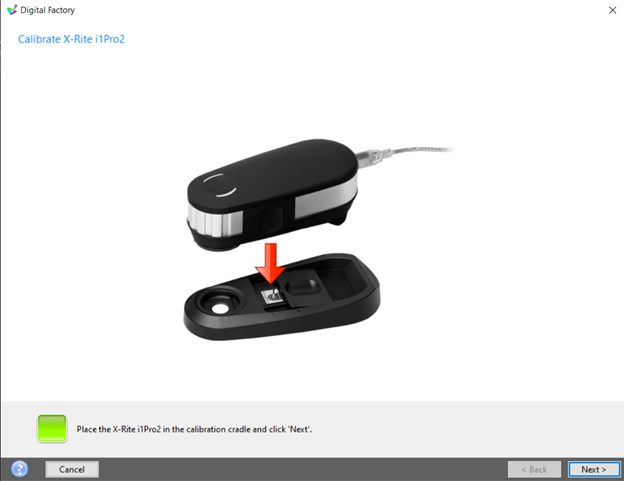
Follow the process by measuring the printed chart with the chosen spectrophotometer. The page will update as you progress through scanning, adding confirmation checkmarks for each completed row.
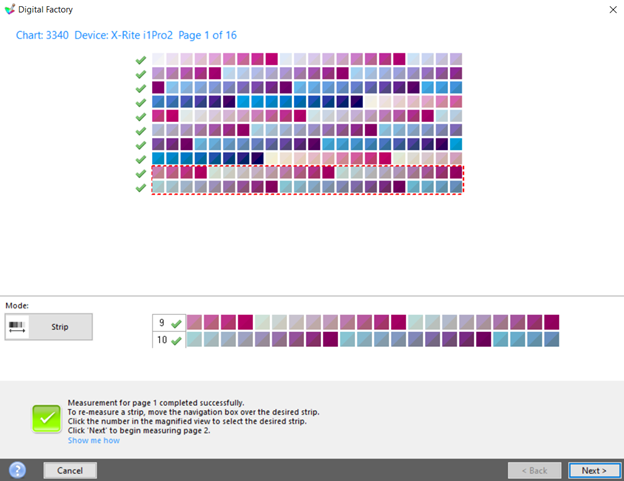
Proceed through each page, scanning the coresponding measurement chart as specified. Once completed, another confirmation checkmark will appear next to the Measure Charts button.
Move through the pages until the Finish button becomes available. The final pages may display a summary of the information obtained through scanning, or a simple summary of the created icc or calibration result.
Upon completion of the Measuring Charts process, the measurement service will close and return to the Printmode Manager window. The new printmode will be active for the selected queue.
Fiery family of software products
Making your machines run better
Copyright © 2026, Fiery LLC. All rights reserved. Privacy Policy.