Fiery Calibrator
Fiery Calibrator serves to determine the total ink limits of your device, optimize the calibration curves by scanning charts with a spectrophotometer, and ultimately assemble all the information into a custom output profile for your device.
Total Ink Limits
The calibration process begins with setting the Total Ink Limits, also known as TIL. For DTG, DTF, and UV printers, it is recommended to use the pre-selected total ink limit value when printing the initial TIL chart. This value will be adjusted to your desired total ink limits after printing and reviewing the chart.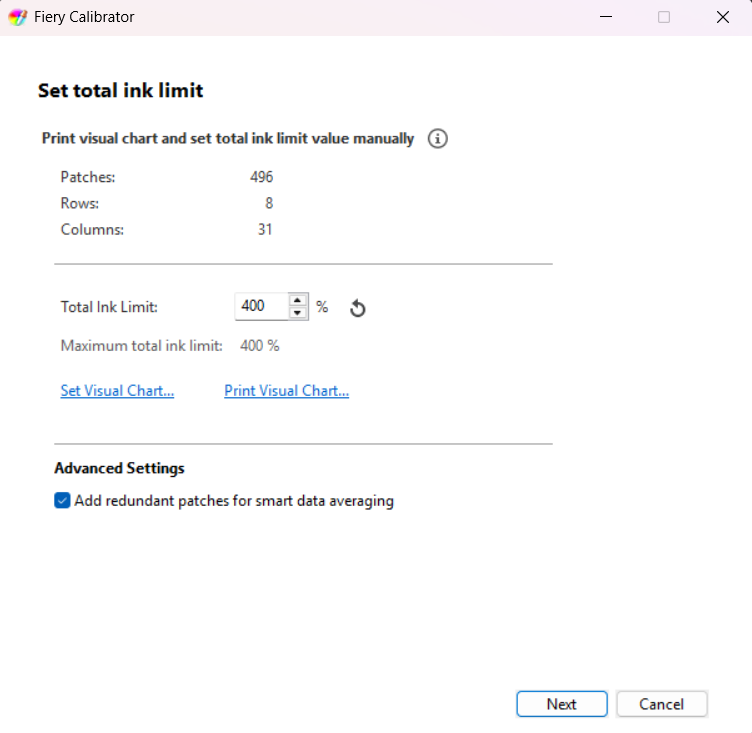
Use the Print Visual Chart button. A Patch Layout confirmation page will populate on screen. This will show the TIL chart preview and list the total pages to be created. 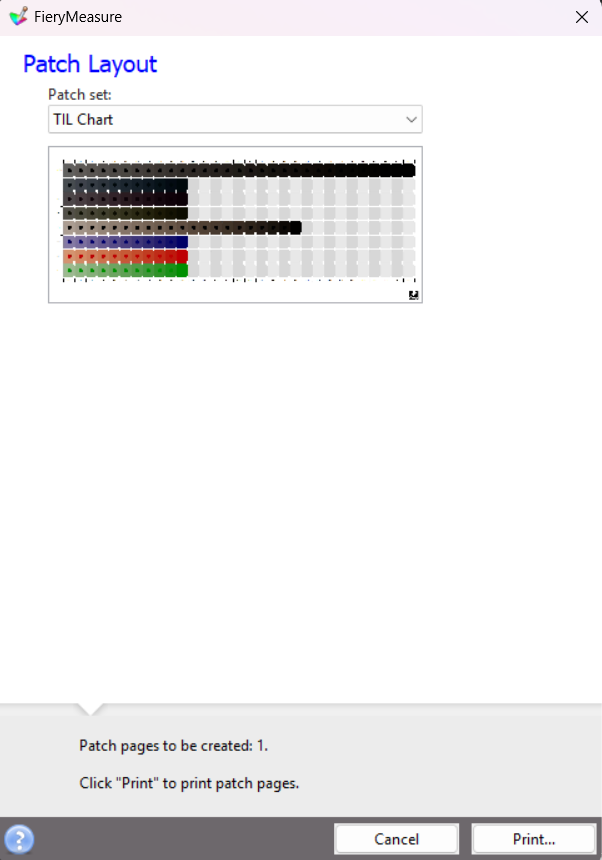
Use the Print button to output the page to your device.
Review the Total Ink Limits Chart
The TIL chart consists of rows of patches, where each column resembles total ink coverage as outlined by the column header. Each hexagon within a row is filled with the same color combination as the right-most (last) patch. The background and the hexagon in the last patch are made up of the same ink values, making this patch appear uniform.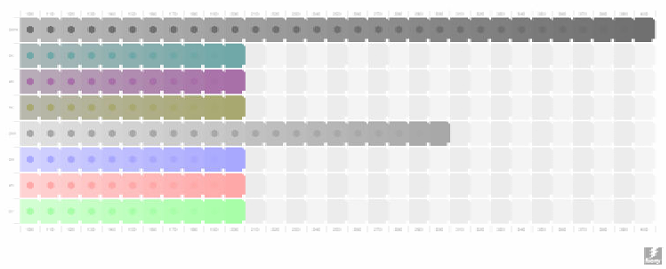
For DTG and DTF devices, it is highly recommended to transfer the chart onto a garment before reviewing for more accurate results. Do not attempt to review the chart without transferring unless problems are already apparent, such as ink values being significantly too high. For UV devices, it is ideal to minimize the surface reflection on the chart. Viewing the chart inside a light booth, or on a wall at the observer's height can resolve this issue.
The optimal TIL value is determined by finding the first column devoid of print errors where the columns after do not have a notable change regardless of ink levels.
In the example below, over-inking begins to occur at a TIL value of 165. Therefore, it is optimal to have a selection in the "good" range of 150-160 depending on preference.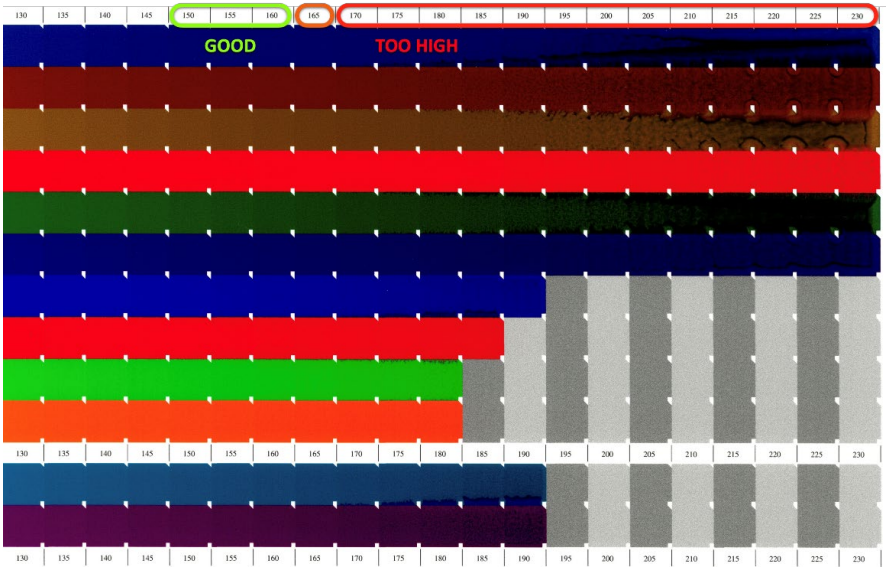
When reviewing the TIL chart, the white separator between patches serves as another indicator for high TIL values. Inspecting these separators can reveal print errors such as :
-
Fringing
-
Inter-color bleeding
-
Mottling
-
Speckling
Errors such as these can also indicate over-inking, such as in the example below.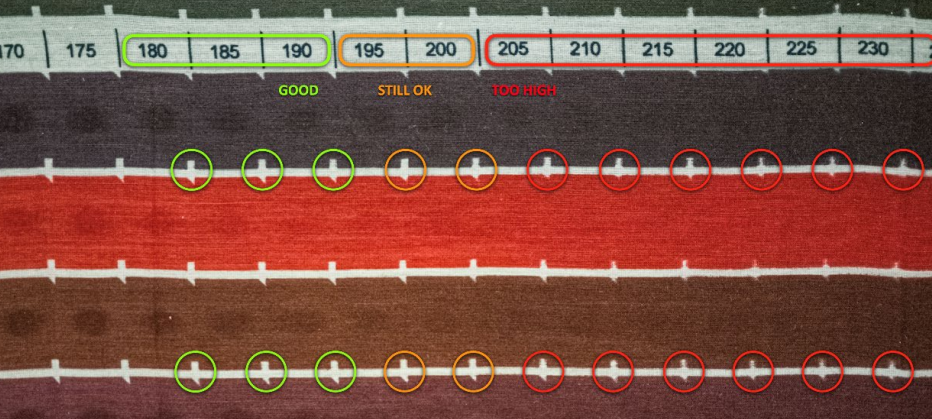
Using the Total Ink Limit field, enter the optimal value using the information gained from reading the charts.
Click Next to print the Calibration Chart and continue.
Calibration Chart
This stage of Fiery Calibrator will require you to print and scan a multitude of color swatches to determine the ideal calibration curves of your device's ink channels. By clicking to get to this step the chart will automatically output, or be placed into Digital Factory's Active Job List, depending on your chosen settings.
Scan the chart using your spectrophotometer. Information on using individual models of spectrophotometers can be found here.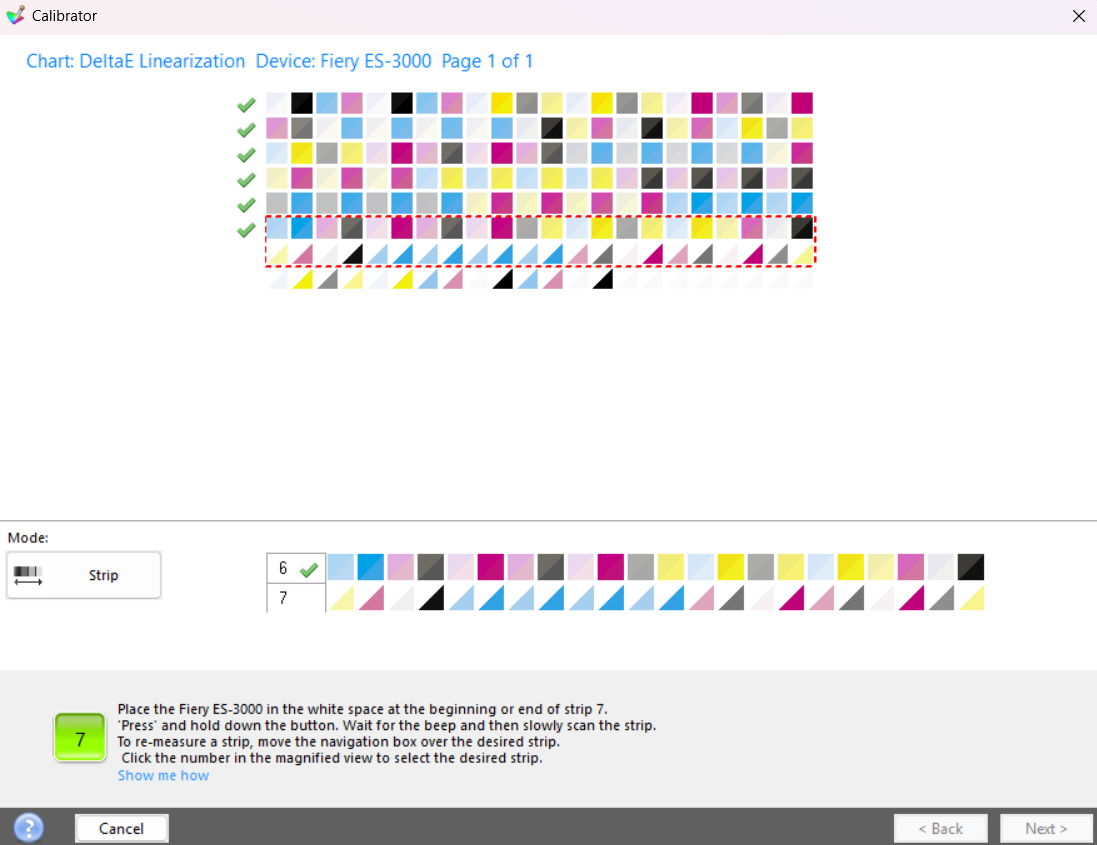
Once scanned, Fiery Calibrator will display an overview of the achieved calibration curves for each color separation. If desired, the ink limit determined by Fiery Calibrator can be manually adjusted using the Normal Ink Full-Tone Value field.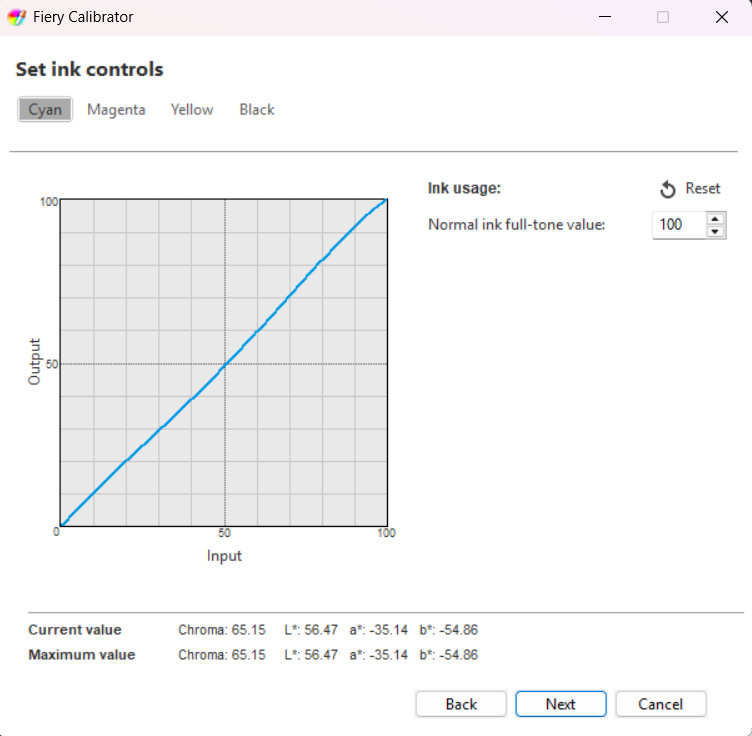
Click Next to finalize calibration and move to Profiling.
ICC Profile Creation
Fiery Calibrator will assemble a custom output profile for your specific device, media, and ink combination. This profile will be created using the selected base printmode, screening options, ink limits, and calibration curves as determined in the previous steps.
If you are following the full Fiery Color Profiler process, Fiery Calibrator will automatically take you through the profile creation steps. The setup described below can be ignored and you can jump directly to the Easy or Advanced Mode selection step.
To create an ICC profile, the selected printmode must have calibration data available. If no calibration data is available, an error message will display informing you of the missing requirement.
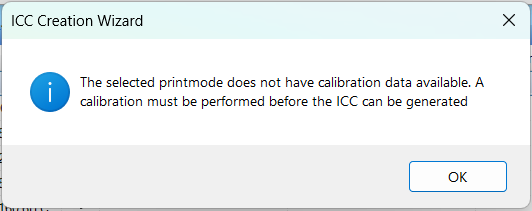
If required, select your desired printmode and perform calibration by using the Calibration button in the Printmode Manager window. The steps at the top of this page can assist in navigating the calibration process.
Once a valid printmode with available calibration is selected, click the Create ICC button in Printmode Manager. A prompt will appear to name the new printmode and choose if you would like to enable advanced screening.
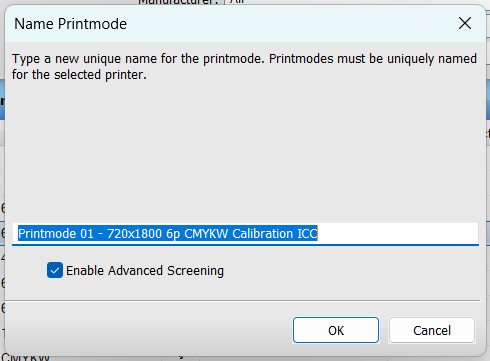
Advanced screening determines how pixels are positioned during the screening process. For almost all cases, it is highly recommended to keep this option enabled. Click OK to proceed to the next page.
An introduction page will display with the option to automatically send jobs to the printer. By default, this is enabled, resulting in any required charts automatically outputting to your device when required for profile creation. By selecting No, jobs are held in the Digital Factory queue, and must be manually sent to the device.
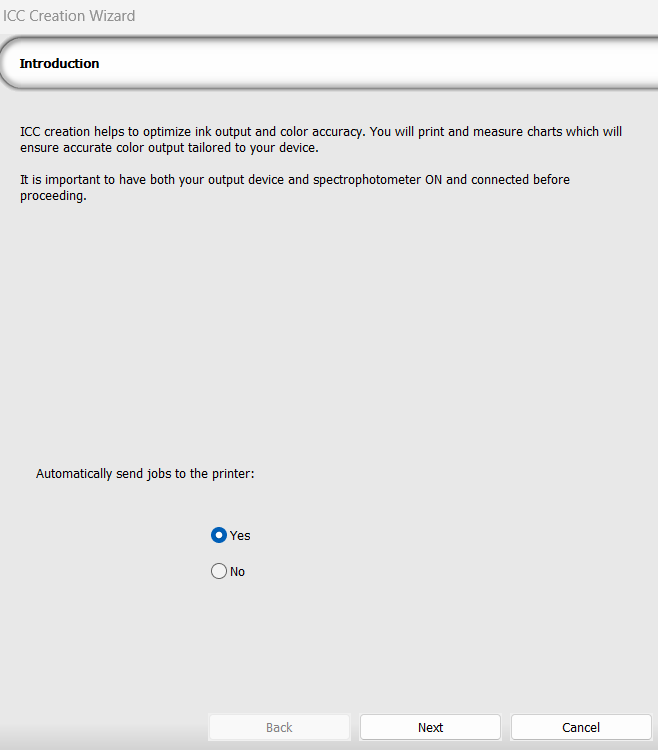
Click OK to move to the next page. The following page displays your current device options. Review and confirm these options before proceeding.
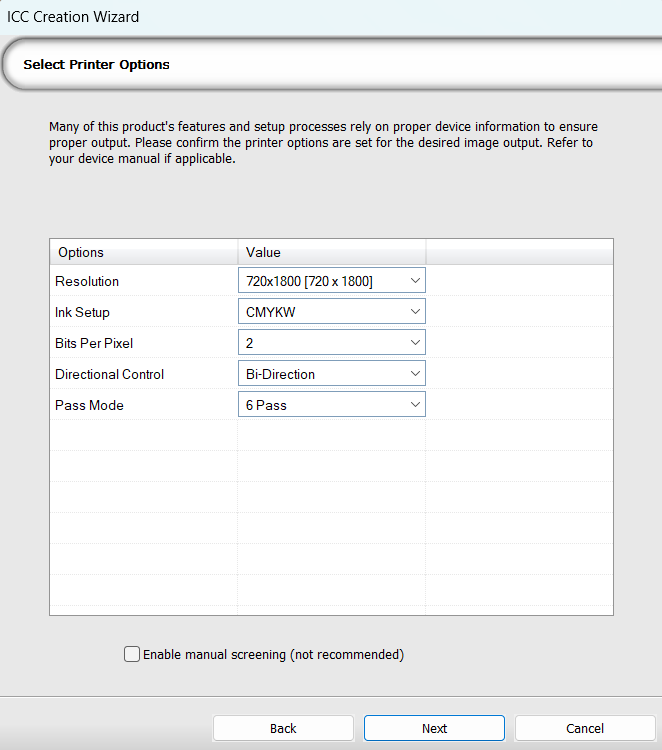
An option is present to perform manual screening. Should you wish to perform manual screening, the steps are covered under the Advanced Mode: Ink Droplet Distribution. Click Next to continue.
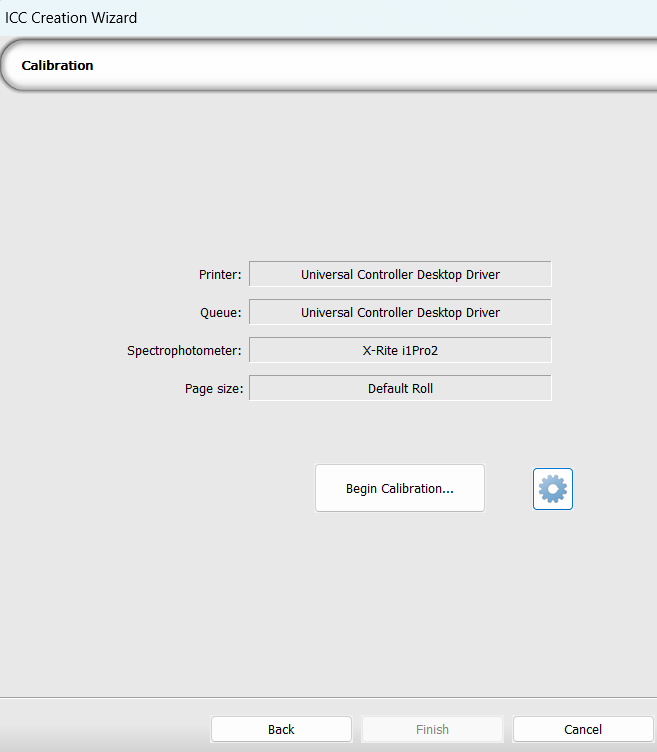
This page serves as a confirmation page before launching Fiery Calibrator. Your chosen printer, queue, spectrophotometer, and page size are all listed for confirmation. Should any of these need to be changed, you will have to exit the wizard, adjust them accordingly, and begin the process again.
A gear button is available for advanced settings within Fiery Calibrator. It is recommended to leave these options in their default settings.
There are two methods of creating a device profile:
-
Easy Mode
-
Advanced Mode
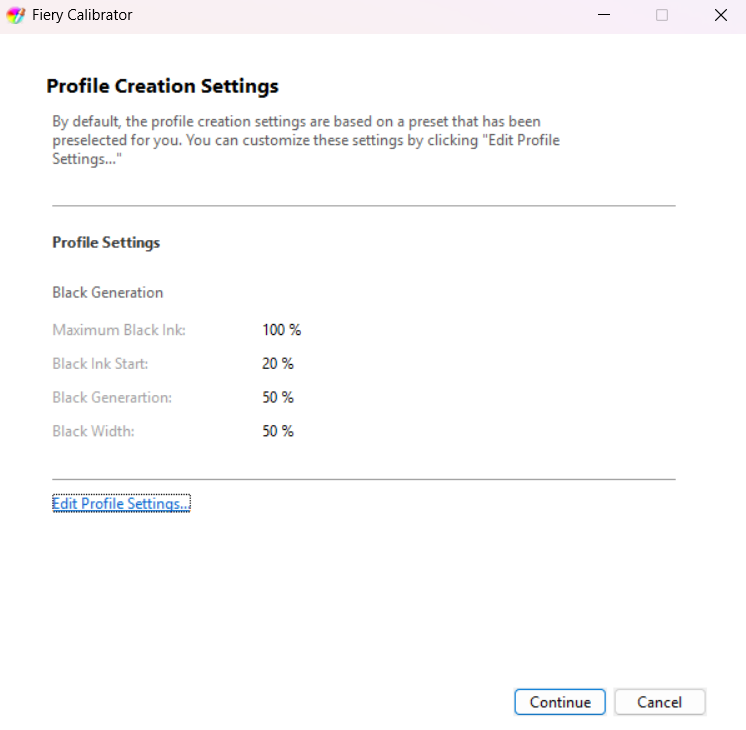
Easy Mode is recommended for most users, as it only requires scanning color swatches to assemble the final profile result. Advanced Mode offers the ability to adjust black ink settings and gamut mapping after scanning. 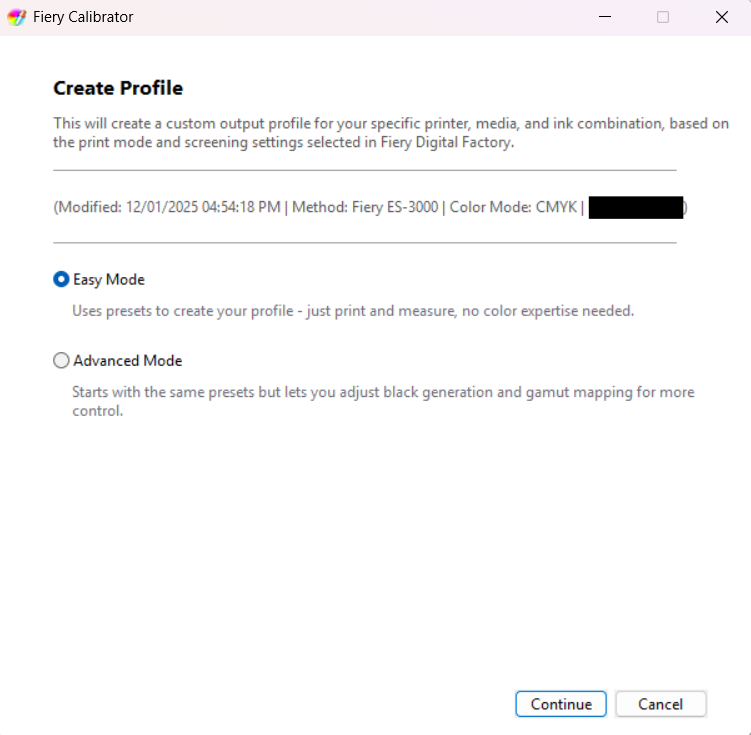
Choose the mode ideal to you, and click Next to print the swatch charts.
Scan the printed color swatches using a spectrophotometer. Information on specific models can be found here. Once completed, click Next to proceed to profile creation.
Fiery Calibrator will automatically process the scanned results into a output profile. The details of the output profile such as the name, color space, printer, and more are shown. 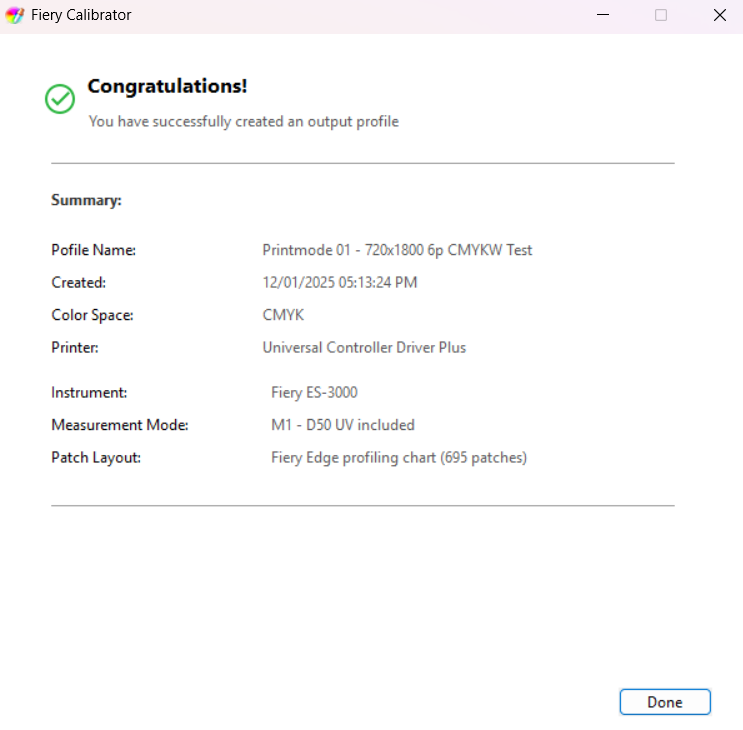
Click Done to apply the profile to the active queue and return to Digital Factory.
Fiery family of software products
Making your machines run better
Copyright © 2026, Fiery LLC. All rights reserved. Privacy Policy.